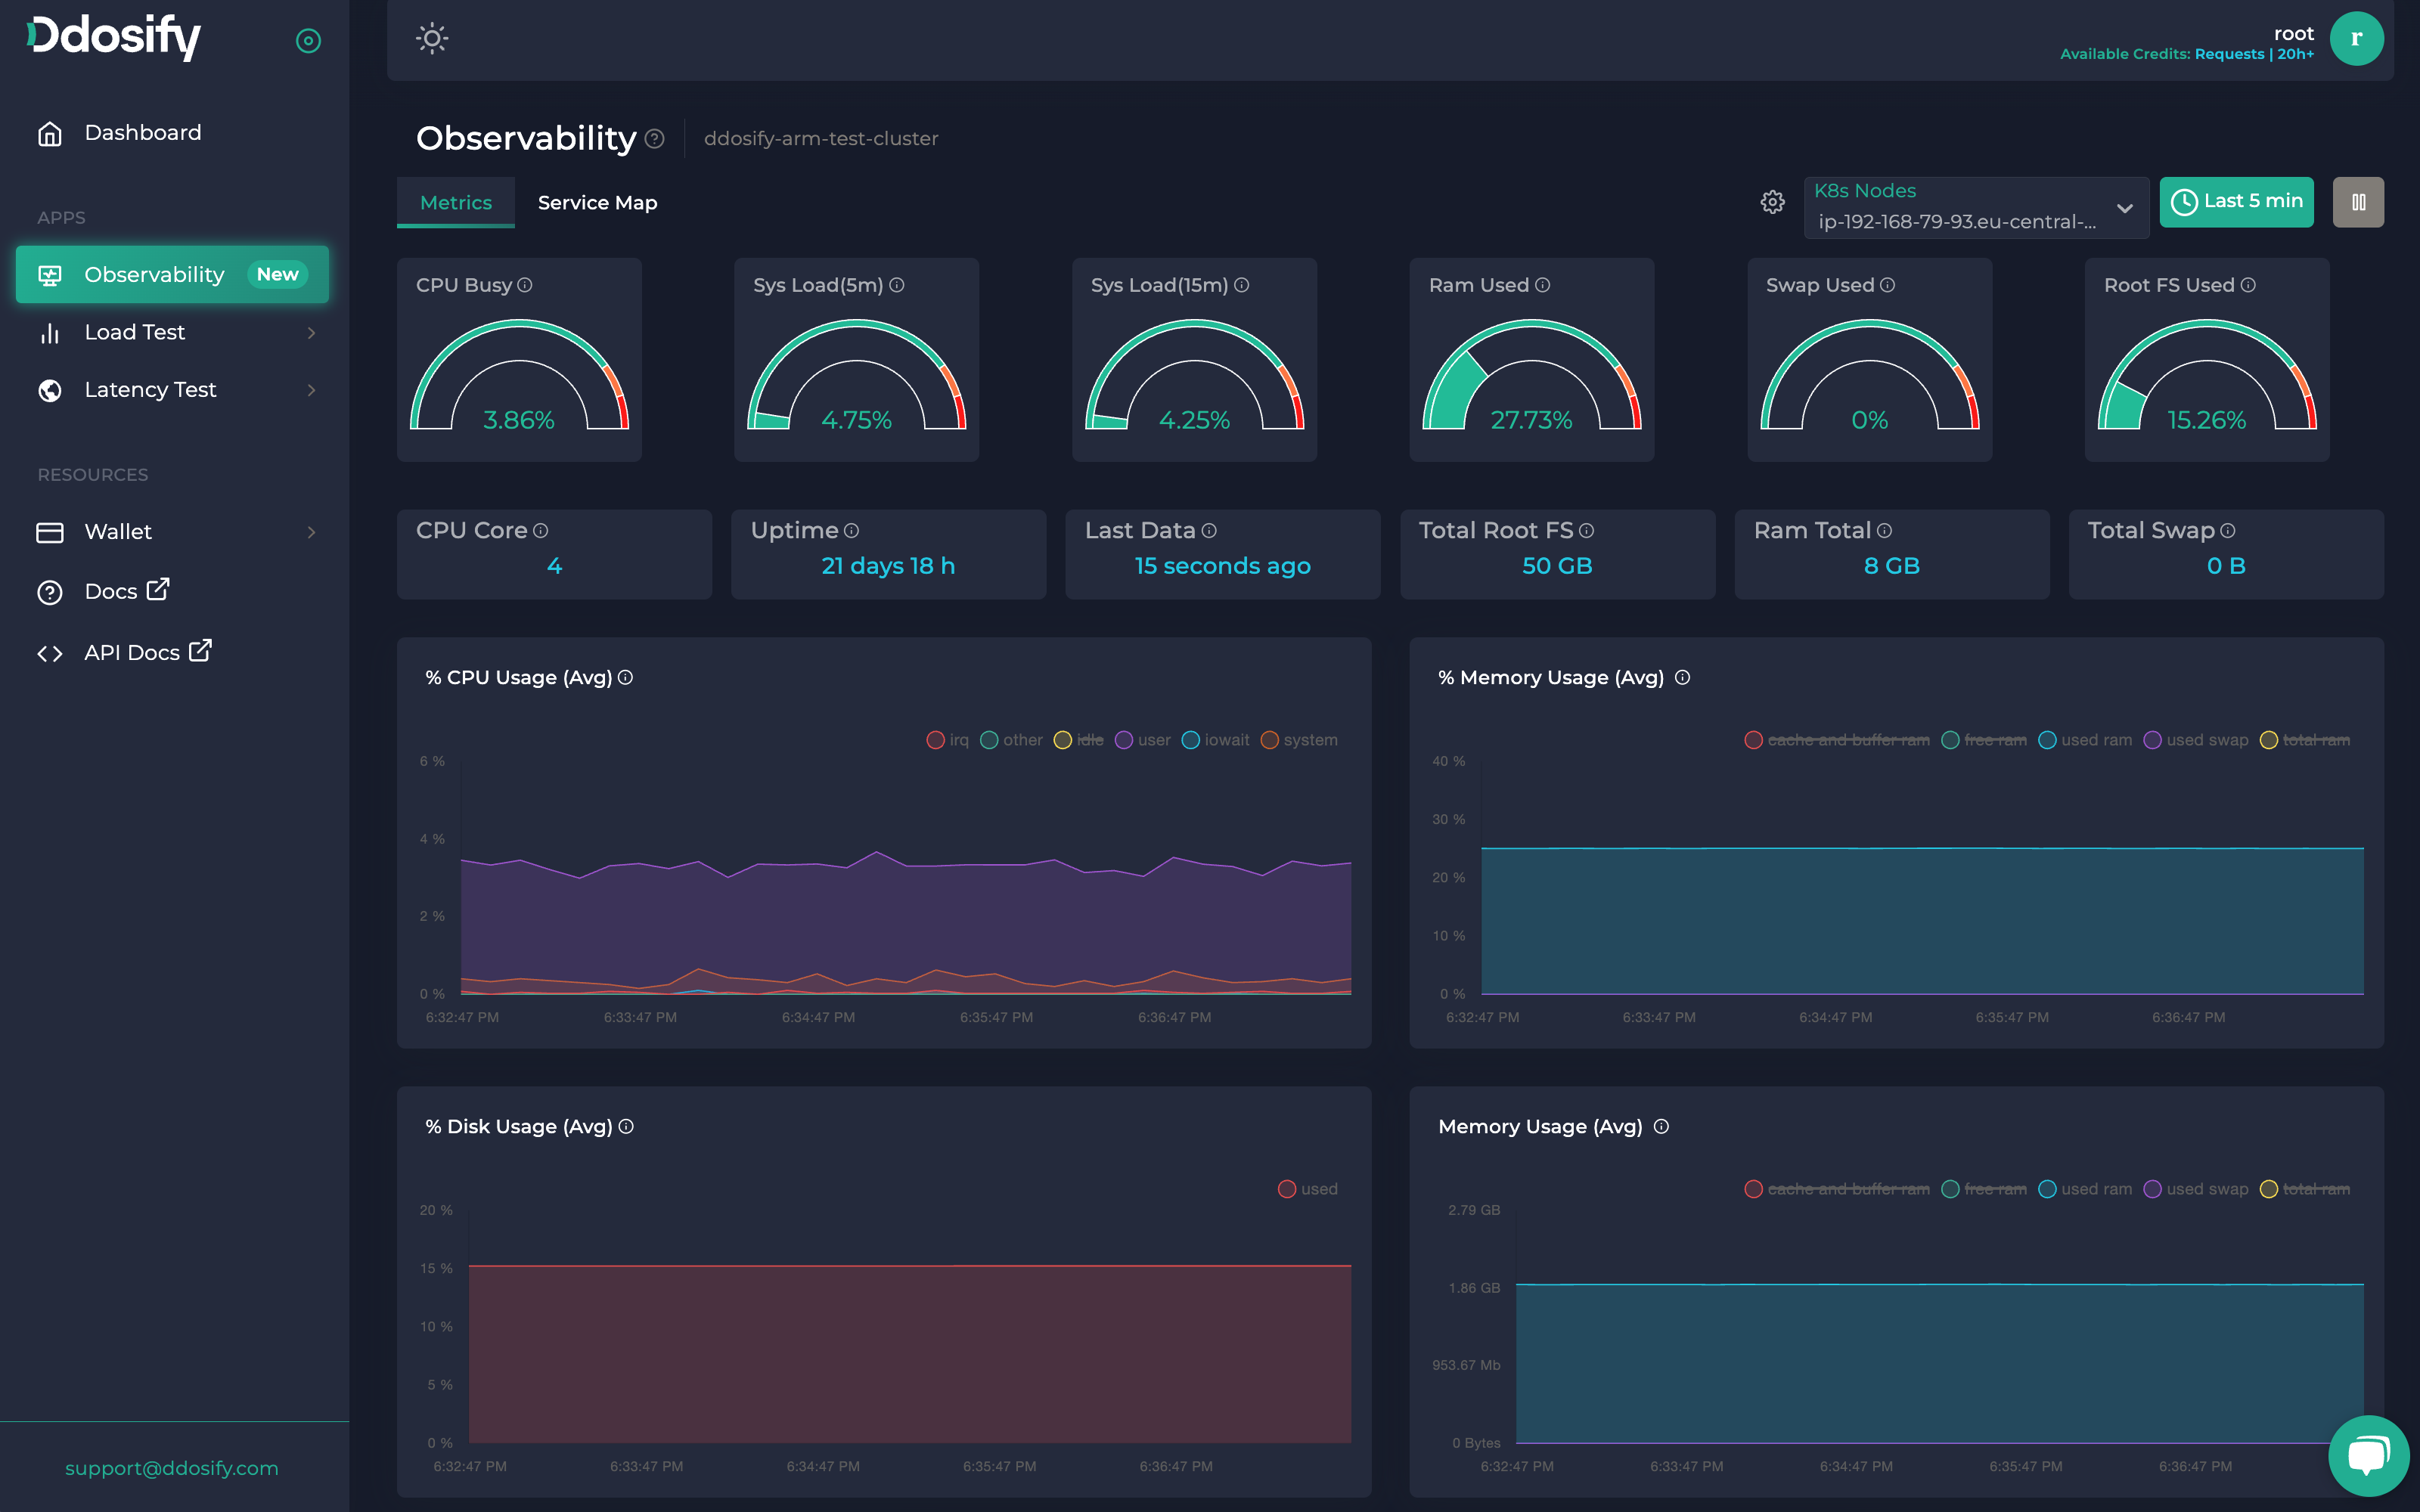
lastYou can inspect CPU, Memory, Disk and Network metrics with out-of-box dashboards

lastYou can inspect CPU, Memory, Disk and Network metrics with out-of-box dashboards
Clusters page
Metrics page
A cluster needing setup
Setting up Alaz using Kubectl
Node filtering
Time selection
The first half of the gauge metrics
| Metric | Definition | Meaning | Numerics |
|---|---|---|---|
| CPU Busy | The amount of time the CPU spends executing non-idle tasks. | High CPU busy percentages over extended periods might indicate that the system is under heavy load, potentially leading to slower response times or performance issues. | It is given as a percentage of the time spent non-idle over the total time spent and can’t exceed 100%. |
| Sys Load (5m) | The average load on the CPU for the past 5 minutes. Sys load represents the number of processes currently running. | If the load consistently stays high compared to the system's capacity (number of CPU cores, for instance), it could signify that the system is under heavy demand or possibly overloaded. | It is given as a percentage of the average process count over the last 5 minutes and it can exceed 100% depending on the CPU core count. |
| Sys Load (15m) | The average load on the CPU for the past 15 minutes. Sys load represents the number of processes currently running. | If the load consistently stays high compared to the system's capacity (number of CPU cores, for instance), it could signify that the system is under heavy demand or possibly overloaded. | It is given as a percentage of the average process count over the last 15 minutes and it can exceed 100% depending on the CPU core count. |
| RAM Used | The amount of Random Access Memory (RAM) currently being utilized by active processes and the operating system. | Consistent high usage may lead to performance issues and it may result from memory leaks or inefficient resource usages. | It is given as a percentage of the used amount over the total amount and can’t exceed 100%. |
| Swap Used | Swap is a space on a disk that is used when the amount of RAM (physical memory) is full. | Swap usage indicates the amount of swap space currently being used by the system. High swap usage may indicate that the system is running out of physical memory and is relying more heavily on disk storage. | It is given as a percentage of the used swap space over the total swap space and can’t exceed 100%. |
| Root FS Used | The Root File System (Root FS) contains essential files required for the system to boot and operate. Root FS usage refers to the amount of space on the root filesystem that is currently in use. | High usage could potentially lead to system performance issues or, in extreme cases, cause the system to run out of space. | Given as a percentage of the used disk space over the total disk space. It can’t exceed 100%. |
The second half of the gauge metrics
Avg CPU Usage %
Avg Memory Usage %
Avg Disk Usage %
Avg Memory Usage
Avg Network Usage
Network interface selector
Avg CPU Usage % with 4 modes enabled
Avg CPU Usage % with 3 modes enabled (idle mode is disabled)
Avg Memory Usage % with tooltip